In the current market, financial metrics analysis is important for business growth. Knowing how to use financial metrics is vital. Informed choices affect profits. This article targets entrepreneurs and leaders who want to deepen their grasp of performance indicators.
We’ll explore financial metrics analysis in detail. Many key performance indicators need tracking. Best practices will streamline your evaluation. Learn how WashMetrix can change your methods. Whether you are new or aiming to improve, this guide helps you with insights. Unlocking your business’s potential is on the way. Numbers can create a success map!
Understanding Financial Metrics Analysis
Financial metrics analysis is important for companies that want to check their financial health and performance. Various financial metrics gives companies insights for decision-making and improving operations. The analysis looks at quantitative data points that show a company’s profitability, helping management figure out resource allocation.
Key financial metrics include return on equity, gross profit margin, and net profit margin. Return on equity shows how well a company makes profit from shareholders’ equity, measuring management’s effectiveness in using investments. Gross profit margin finds the percentage difference between revenue and cost of goods sold, helping evaluate production efficiency and pricing. Net profit margin shows overall profitability by revealing what part of revenue remains after expenses.
About 74% of companies use financial metrics for decision-making. This shows how financial metrics helps in measuring performance and allocation of resources. Regularly analyzing important metrics helps firms pinpoint areas for improvement and keep track of financial goals.
In short, strong financial metrics analysis highlights current performance. It also works as a tool for predicting future growth. As we look at essential key financial performance indicators, it’s clear the right metrics helps in business growth.
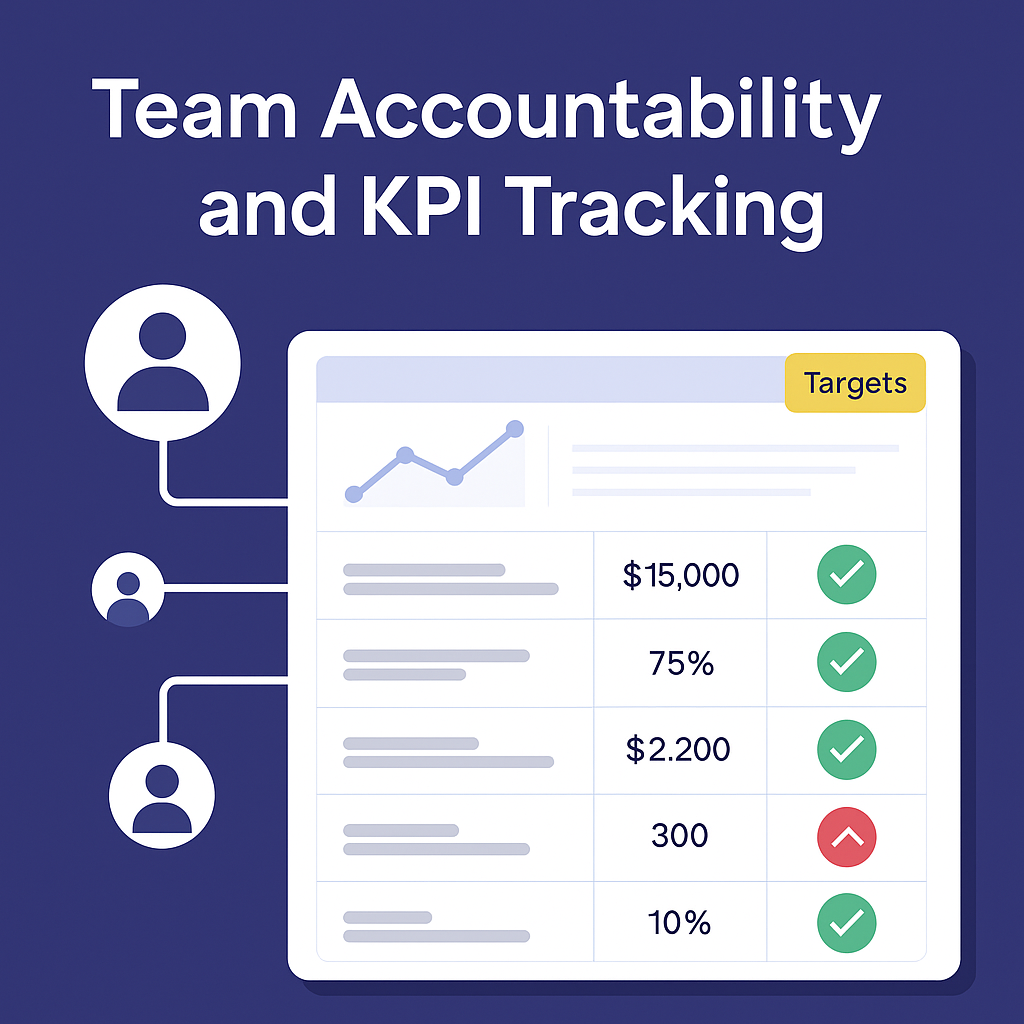
Key Financial Performance Indicators to Track
To analyze financial metrics achive, businesses need to focus on key financial performance indicators. These KPIs give insights into operational efficiency, profitability, and financial health. Tracking these indicators help organizations to make decisions for growth and to sustain competitive advantage.
One key metric is gross profit margin. It measures production efficiency and pricing strategies. You calculate it by subtracting cost of goods sold from total revenue, then divide by total revenue. High gross profit margin means strong management of production costs and sales.
Another important KPI is net profit margin, providing insights into how well a firm controls expenses. This metric is obtained by dividing net income by total revenue. A higher net profit margin is better, reflects the ability to convert sales into profit and shows management practices impact.
Furthermore, companies need to assess their current ratio. It measures short-term financial health by comparing current assets to current liabilities. This KPI hints at a company’s ability to meet short-term obligations. A ratio over 1 indicates sound financial stability. Return on assets measures how well a business uses its assets. A high ROA implies efficient asset use.
In summary tracking KPIs like gross profit margin, net profit margin, current ratio, and return on assets helps evaluate financial performance. This analysis shows where improvement needs to occur and strengthens the financial strategy, key for sustained growth.
As we dive further, understanding challenges in financial metrics analysis is crucial. We will explore this next part.
Challenges in Financial Metrics Analysis
Financial metrics analysis offers many benefits, but businesses encounter problems. Data accuracy is crucial. Small discrepancies lead to incorrect analysis, resulting in poor decisions. If financial data is recorded wrong, metrics do not reflect actual performance of the business.
Another issue is misalignment of KPIs and business objectives. When KPIs aren’t aligned with strategic goals, it leads to disconnect. Companies may prioritize metrics that do not foster growth, causing them to overlook indicators that truly matter for success.
Errors during analysis raise risks. These errors can come from mistakes in data entry, wrong formula uses, or software issues. Each can hurt decision-making. Effects of errors vary from minor miscalculations to larger financial impacts. This emphasizes checks in financial metrics analysis.
To tackle these issues, companies must use effective financial metrics analysis. Regular audits and alignment of KPIs with strategy are key. These steps can improve analysis quality.
Recognizing challenges helps businesses adopt best practices, which streamline financial metrics analysis. This ensures decision-making relies on accurate and actionable data.
Best Practices for Financial Metrics Analysis
Implementing best practices for financial metrics analysis improves accuracy and provides insights that drive business growth. These strategies play a vital role in analyzing financial health effectively.
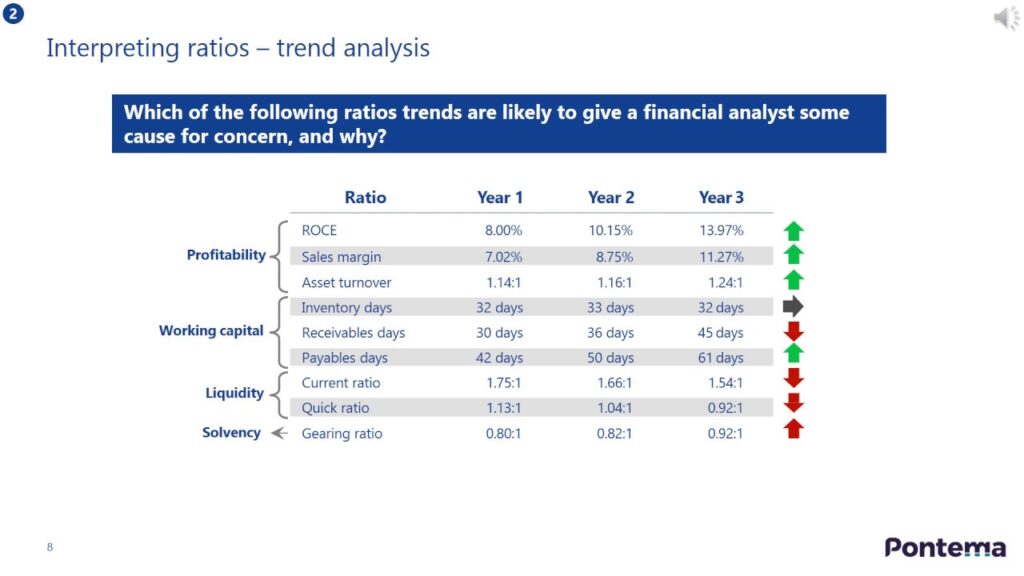
Employ both horizontal and vertical analysis. Horizontal analysis evaluates financial data over time, showing trends and fluctuations in performance. Vertical analysis present each item as a percentage of a base figure, usually total revenue or total assets. This approach offers a thorough view of financial performance across time and dimensions.
Ratio analysis also gives insights into a company’s financial state. Important ratios like current ratio, quick ratio, and debt-to-equity ratio assist with liquidity, efficiency, and leverage. Measuring these ratios often allows businesses to spot operational issues early and maintain stability.
Using industry benchmarks in your financial metrics analysis provides an important context. Comparing your performance with industry standards shows how you perform against the competition. Understanding your position helps highlight strengths and weaknesses, guiding necessary changes. Firms using benchmarks often perform 30% better in financial metrics.
Timeliness is essential for financial metrics analysis. Regularly update and check financial data to ensure accuracy. Old data can lead to major financial troubles. Set a routine for reporting, either monthly or quarterly to support proactive management.
To sum up, these best practices—using horizontal and vertical analyses, applying ratio assessments, benchmarking, and being timely—enhance your financial metrics analysis. These changes lead to informed decisions and planning for growth.
As you adopt these methods, explore tools like WashMetrix for deeper insights in your financial metrics analysis.
Utilizing WashMetrix for Financial Metrics Analysis
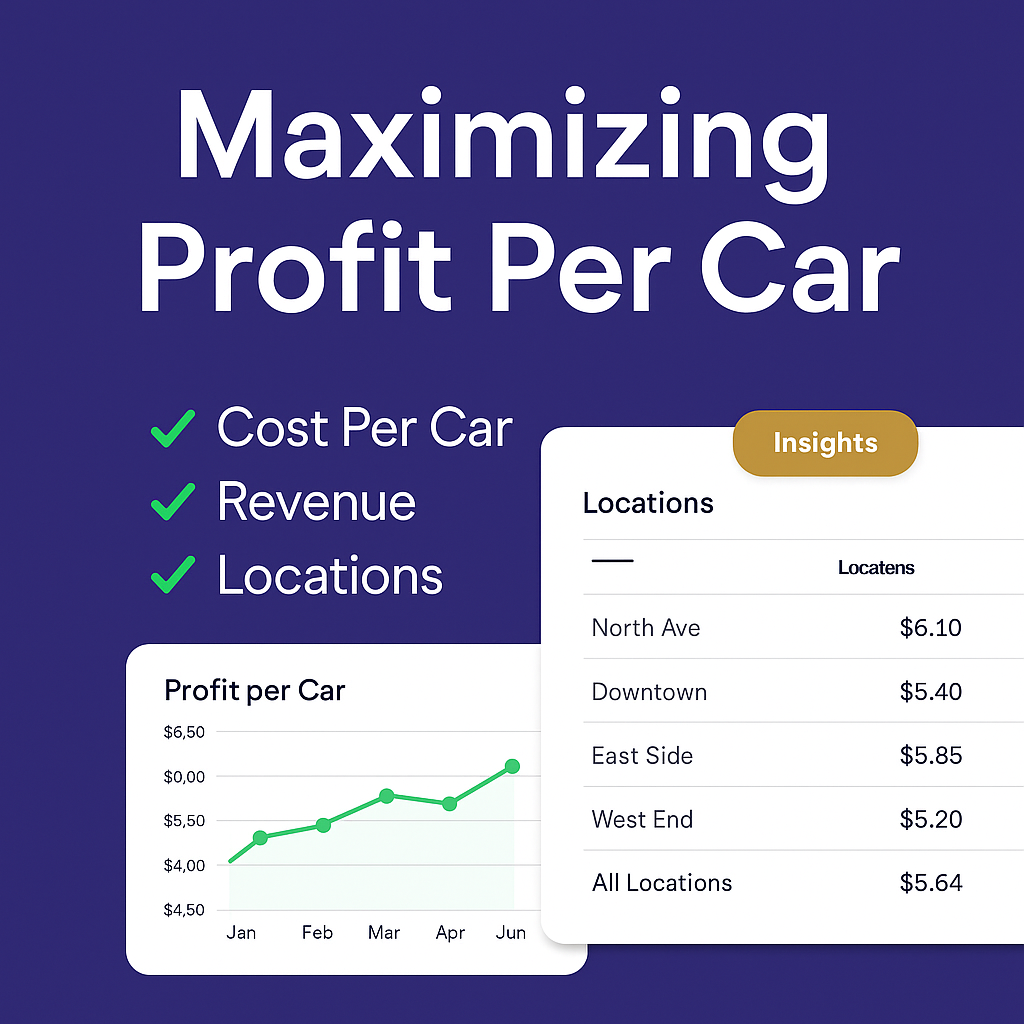
As we shift to best practices for financial metrics analysis, it’s important to examine how WashMetrix supports car wash operators. WashMetrix acts as a complete tool for consolidating essential financial metrics, displaying them on a centralized dashboard. This simplifies choices and improves efficiency.
The platform lets users see key performance indicators like revenues, expenses, and profit across different locations. This visualization provides a strong view of financial health and helps in comparative analysis. Operators can check performance variations among branches, finding top locations and those needing attention.
Using WashMetrix, users get useful insights that enable better decisions. The data aggregation features allow for tracking trends over time. For example, watching operational expenses aligned with revenues could show ways to save costs or invest in growth.
Moreover, WashMetrix has advanced analytics tools for financial metrics analysis. Users gain access to comprehensive reports that show financial behavior patterns, enabling prompt actions to deal with any issues. Combining these insights with historical data leads to a richer understanding of profit drivers.
In conclusion, using WashMetrix simplifies the financial metrics analysis and gives car wash operators the tools needed to boost their business growth. By adopting this platform, operators improve their financial skills and maintain competitiveness in the market.
Conclusion
In conclusion, understanding financial metrics analysis is vital for your business success. This article explored core elements of financial metrics analysis, focusing on key performance indicators and common challenges. We shared best practices to analyze these metrics and how WashMetrix can assist you.
With the strategies for financial metrics analysis in mind, it is time to act. You may start by monitoring key KPIs or use analytical tools. Each action enhances your grasp on your financial situation.
Utilize financial metrics analysis effectively to foster your business growth. The essential part involves not only measuring but also making informed choices that advance your success.
About WashMetrix
WashMetrix is a business intelligence platform tailored for the car wash industry, providing comprehensive data analytics that enhance financial tracking and operational efficiency.
This platform matters because it aggregates metrics from various systems into a single dashboard, empowering car wash operators to visualize key performance indicators and make informed decisions to optimize their performance.
Discover how WashMetrix can transform your car wash business by visiting washmetrix.com today!